Here is the uncomfortable framing most companies still avoid. We know how to calculate ROI for capital investments — equipment, infrastructure, acquisitions. But AI implementation? Still treated as an operating expense. A cost line. Something to absorb, not evaluate.
That distinction is increasingly hard to defend. If AI changes how work gets done — how decisions are made, how time is allocated — then it behaves like an investment. And investments get evaluated. So let's evaluate this one.
This article applies a simple principle: if reporting consumes economic value, then improving it should generate measurable return. A return you can calculate. A return you should calculate.
Here is a number that should bother you: $93,600. That is how much revenue one account manager leaves on the table every year — not because they are bad at selling, but because they spend 10 to 15 percent of their time updating CRM fields, reformatting spreadsheets, and reconciling numbers that never quite match. The budget line says “reporting: ~$50K.” The actual cost runs almost double. Nobody notices, because the drag is invisible.
Companies measure everything. Revenue, margins, CAC, LTV — the outputs get tracked to the decimal. But the system that produces those numbers? The pipeline of pulling, cleaning, reconciling, formatting, and finally interpreting data before anyone can act on it? That gets treated like plumbing. Neutral infrastructure. Just… there.
Except it is anything but neutral. Reporting is a production system with its own throughput problems, its own failure modes, and its own cost structure — one that barely shows up in any budget. The research on this is scattered across productivity studies, accounting literature, and digital reporting analyses. But pull the threads together and the pattern is obvious: labor is the smallest line on the real bill. The big charges are delay, inconsistency, and the friction that seeps into every decision downstream.
Treat reporting like a production system
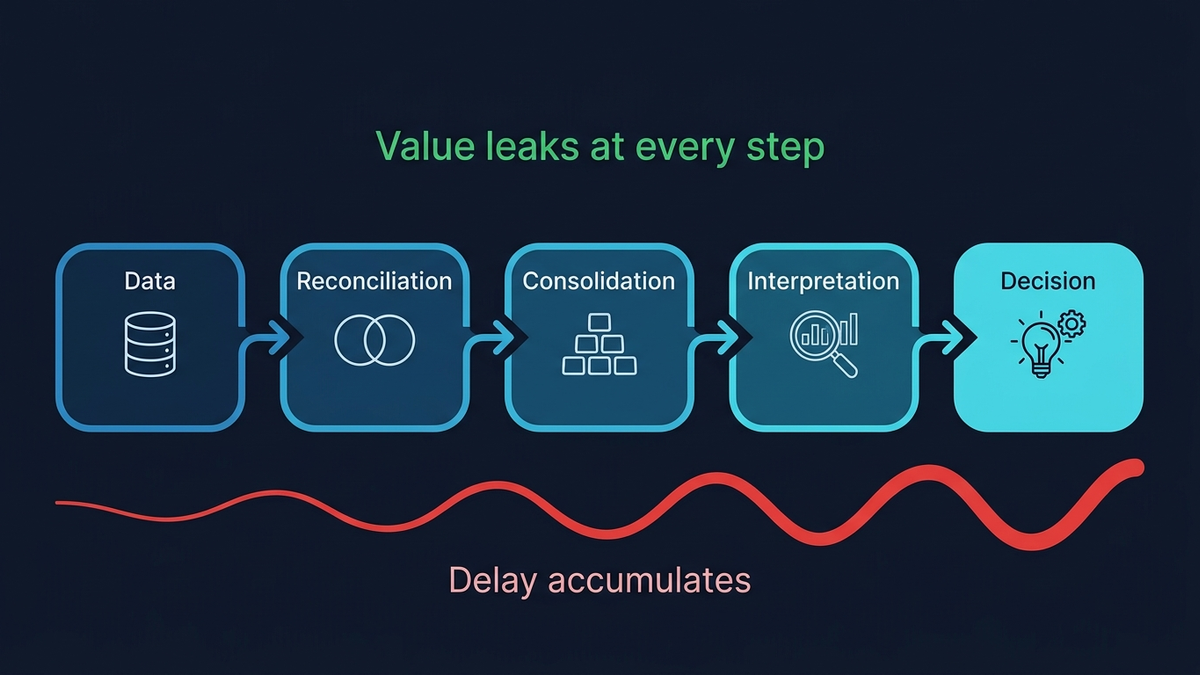
Forget the PDF. Forget the dashboard. A report is a pipeline:
data → reconciliation → consolidation → interpretation → decision
Every step transforms the information. Every step adds delay. And every step is a place where things quietly go sideways. The OECD's 2025 analysis of generative AI adoption nails this: productivity gains depend less on the automation itself and more on how the underlying workflow is structured. Garbage process in, faster garbage out. You can bolt a jet engine onto a shopping cart. It will still be a shopping cart.
The reconciliation problem
Picture the Monday morning leadership meeting. The VP of Sales pulls up pipeline numbers. The CFO pulls up revenue. Marketing pulls up attribution. Three dashboards. Three different answers to the same question: “How did we do last quarter?”
Nobody is wrong, exactly. Each system encodes a different slice of reality:
- CRM reflects pipeline logic
- Finance reflects recognized revenue
- Marketing reflects attribution
Internally consistent. Mutually incompatible. And reconciling them means transformations that are almost never standardized — someone in finance has a spreadsheet with magic formulas, and if that person goes on vacation, God help you. This adds up fast. The 2025 Global Finance Survey by Planful found that 68% of finance teams now close books within five days— a genuine achievement — yet reconciliation and consolidation remain stubbornly manual. Record-to-report workflow research tells the same story: persistent manual work, fragmented data, siloed processes.
You moved the paperwork to a screen. The mess stayed.
The errors are baked in
Here is the part nobody wants to talk about. Reporting errors are baked into the process. They are small, cumulative, and mostly invisible until something blows up. They creep in through entirely predictable channels:
- Selection bias— what gets included (and what quietly doesn't)
- Recency bias— last week's numbers drowning out last quarter's trends
- Formatting bias— the chart that makes a 2% shift look like a cliff
- Version drift— three “final” versions floating around, none identical
- Untraceable adjustments— someone tweaked a number in cell G47 last Tuesday and nobody knows why
Manual systems produce these by design. The IFRS Foundation's research on digital reporting confirms that reducing manual handling improves consistency and traceability. But here is the genuinely uncomfortable wrinkle: other research shows that automation without proper governance can actually reduce reporting quality. Removing human hands from the process does not magically make it accurate. It just means the system becomes more sensitive to how well it was designed in the first place.
Your Monday numbers arrive on Thursday
A 2024 NBER study found that AI shaved roughly 1.4% off total knowledge-work hours. Sounds laughably small. But even that sliver had measurable system-wide effects — because the bottleneck was never raw effort. It was time. The gap between when something happens and when anyone can react to it.
That gap — decision latency — is where manual reporting quietly bleeds money. Performance shifts on Monday. The report lands on Thursday. For three days, pricing drifts. Cost overruns compound. Capital sits in the wrong place. And nobody knows, because the numbers have not arrived yet. Three days of flying blind, every single week.
Real-world AI-assisted workflows show roughly 14% productivity gains. Those numbers come from broader contexts, but reporting concentrates exactly the kind of repetitive, transformation-heavy work where those gains hit hardest. If your job involves pulling numbers from System A, reformatting them for System B, and emailing them to someone who puts them into System C — congratulations, you are a human middleware layer. And middleware is what automation eats for breakfast.
The five costs of reporting (you are tracking one of them)
Your budget captures one line: labor. Here is what it misses:
- Labor— the only one on your spreadsheet
- Cycle-time delay— decisions waiting for data
- Reconciliation overhead— making three systems agree
- Error and rework— fixing what nobody caught the first time
- Decision friction— the meeting-before-the-meeting where everyone argues about whose numbers are right
That last one deserves its own paragraph. According to the Global CeFPRO Report, 66% of banking organizations cite manual reporting time as a primary cost driver, alongside inconsistent data across documents. But that cost is smeared across the entire org — a little here in finance, a little there in ops, a recurring calendar invite called “data alignment sync” that everyone dreads. None of it lands on any single budget line.
Your ammunition for the budget meeting
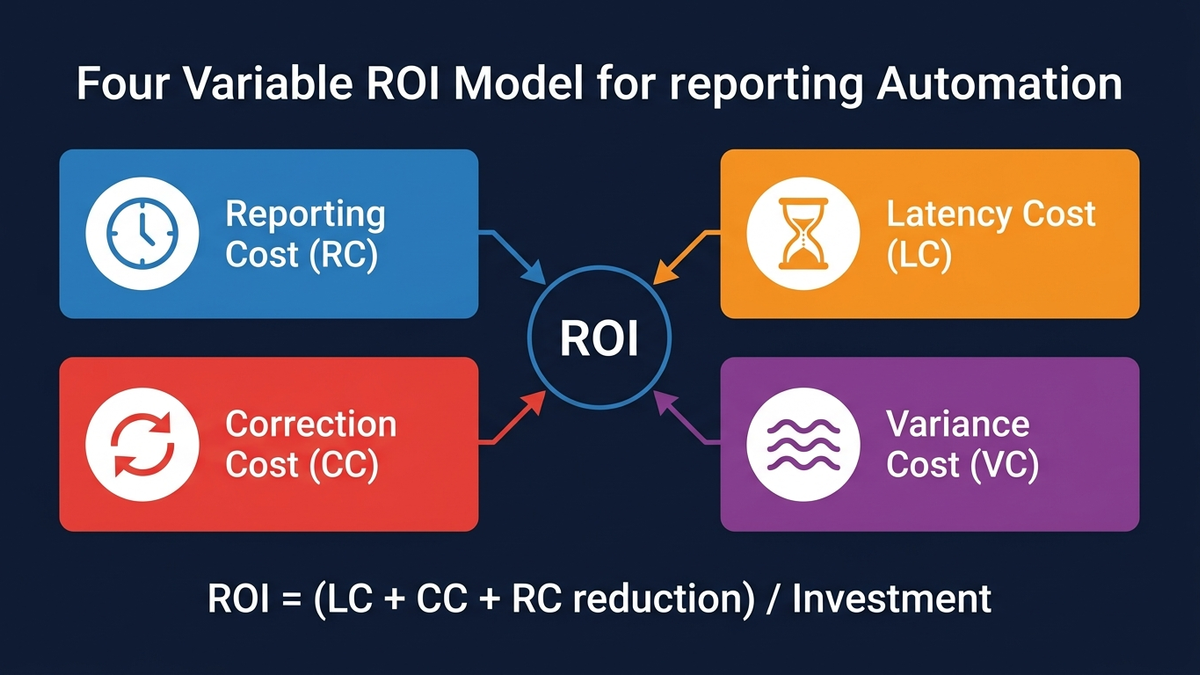
Want to make the case for fixing this? You need numbers, not vibes. Here are four variables that capture the real cost of reporting. Think of them as the components of the bill nobody sent you.
1. Reporting Cost (RC)
RC = sum of (hours × fully loaded cost)
The one everyone already tracks. Hours spent pulling data, building decks, formatting spreadsheets — multiplied by loaded cost per hour. Simple. And almost always the smallest piece of the actual cost. This is the decoy.
2. Decision Latency Cost (LC)
LC = Value at Risk per day × Decision Latency (days)
This is the big one. How much money sits exposed while you wait for numbers to arrive? A pricing anomaly bleeds margin for three days before a human being sees it. A campaign burns budget for a week before anyone realizes it is targeting the wrong segment. Latency cost compounds silently, and it is almost always larger than the labor it takes to produce the report.
3. Correction Cost (CC)
CC = (revisions / total reports) × RC × rework factor
Every revision cycle burns the same labor again — plus the overhead of hunting down what went wrong and who is still working off the old version. (Answer: at least two people. Always.) The rework factor captures the disruption beyond raw hours — the Slack threads, the “hey, are you looking at v3 or v4?” messages, the quiet erosion of trust in the numbers themselves.
4. Variance Cost (VC)
VC = time spent aligning numbers across teams × blended cost
The meeting-before-the-meeting tax. Sales says one number. Finance says another. Marketing has a third. Nobody is lying — they are just pulling from different systems with different definitions, different cutoff dates, different rounding conventions. These alignment conversations eat hours every week and slowly erode confidence in the data itself. At some point, people stop trusting the numbers entirely and fall back on gut feel. Which, of course, is exactly what all this reporting was supposed to prevent.
The full picture
Reporting ROI = (LC reduction + CC reduction + RC reduction) / investment
Notice what this formula is telling you: labor savings are typically the smallest component. The real ROI comes from cutting latency and killing inconsistency. If your automation business case rests entirely on headcount reduction, you are measuring the tail and ignoring the dog.
Where AI actually changes things (and where it does not)
AI gets pitched as a speed layer — same work, fewer humans. Fair enough. But the more interesting shift is structural. AI changes where errors enter the system:
- At the data layer, it catches inconsistencies before they propagate downstream
- At the transformation layer, it standardizes definitions across systems so “revenue” means the same thing in every report
And at the interpretation layer — where most variance quietly creeps in — it shrinks the gap between what actually happened and how it gets reported. Faster reports are a side effect. The real win? Reports you can actually trust without spending an hour double-checking them. Experimental evidence from Science shows improvements in both speed and quality for professional writing tasks. But — and this matters — the OECD synthesis is clear: the value comes from embedding AI into the workflow, not sprinkling it on top. Bolting a chatbot onto a broken process just gives you a broken process that hallucinates faster.
The $50K line item that was actually costing $140K
A B2B company. Contract-based revenue, roughly 40,000 EUR average deal value. They were spending about 20 hours a week on manual reporting — CRM updates, sales activity logs, finance coordination. The budget said: ~50,000 EUR per year in reporting cost. Clean number. Fit nicely on a slide.
Then someone actually tracked where the time went. A typical account manager was losing 10 to 15 percent of their working hours to:
- Updating CRM fields across every lead and stage
- Logging and structuring call outcomes
- Reviewing conversations for patterns (manually, in 2025)
- Packaging structured inputs for analytics and marketing
- Reconciling closed deals with finance and contracts
On paper, that is “reporting labor.” In practice, it is selling capacity that vanished. Every hour an account manager spends copy-pasting between tabs is an hour they are not on the phone closing. The budget captured the cost of reporting. It completely missed what reporting was costing in lost deals.
So they ran the numbers. Ten qualified leads per week, 3% conversion rate, 40,000 EUR average contract value:
- Before: 0.3 deals per week → 12,000 EUR in expected weekly revenue
- After recovering ~15% of capacity: lead handling jumps to ~11.5 leads per week
- Same conversion rate: 0.345 deals per week → 13,800 EUR in expected weekly revenue
- The gap: 1,800 EUR per week → ~93,600 EUR per year, per sales role
Translating impact into ROI
The previous example showed an annualized impact of ~€93,600 per sales role. But full impact rarely lands on day one.
Adoption introduces friction: partial usage, behavioral inertia, transition slowdowns, people reverting to old habits when they are stressed. You know how it goes.
A realistic model assumes:
- ~60% realization in the first 6 months
- ~80% in the following 6 months
Year 1 realized impact
- First 6 months: €93,600 × 50% × 60% ≈ €28,080
- Second 6 months: €93,600 × 50% × 80% ≈ €37,440
Total realized expected additional value within 1st year ≈ €65,500
Investment
Implementation (automation + setup): ≈ €5,000
ROI
ROI = (65,500 – 5,000) / 5,000 ≈ 12.1× return (year one)
Read that again. More than a 12× return on every euro invested — within twelve months. Very few line items in your budget can deliver anything close. And this came from fixing reporting.
Even under conservative assumptions — partial adoption, behavioral friction, incomplete utilization — the return stays materially positive. And the driver here is not cost cutting. The driver is reclaiming productive capacity that was trapped inside a broken system.
After they restructured reporting into an automated pipeline, the weekly cycle collapsed from ~20 hours to minutes. Cross-system discrepancies dropped to near zero. Pipeline visibility improved. Feedback loops shortened. Resource allocation decisions that used to happen at month-end started happening at week-end.
Cost reduction was a footnote. The headline was revenue recovery. That €50,000 overhead line was quietly constraining €90,000+ of annual revenue per account manager. The budget said “€50K cost.” The actual drag was nearly triple.
The CFO didn't have a reporting problem. What looked like a reporting line item was actually a revenue leak — wearing a very convincing disguise.
This gets worse before it gets better
Every new tool your organization adopts adds another reconciliation point. Another system with its own definitions, its own data model, its own API quirks. More surface area for inconsistency. Without structural alignment, complexity compounds as you scale. You do not outgrow this problem. You feed it.
CFO surveys show growing expectations that automation should improve not just efficiency, but data quality and interpretability. Most companies are not starved for data. They are drowning in it. What they lack is a system that converts raw data into decisions with minimal delay and minimal distortion.
Reporting sits between your data and your decisions. It is part of the operating system — and should be treated like one. The question worth asking is not “how do we produce reports faster.” It is: how do we remove latency, variance, and dependency from the system that drives every decision we make?
Because right now, in a lot of organizations, that system is a patchwork — spreadsheets, calendar invites, and one person who knows where the numbers actually live. And yes, that person might be thinking about updating their LinkedIn.
But the real risk goes deeper than personnel. It is structural. You cannot fix it by hiring “the right” CFO or adding more controls. It means recognizing that the current system has hit its ceiling — and being willing to replace it. In practice, that means moving away from manual reporting as a default and treating automation — including AI — as part of the operating model. Not an experiment. Not a pilot. Part of the machine.